
Why Is My Flow Cytometry Signal Weak or My Cell Populations Poorly Separated?
Flow Cytometry Troubleshooting · Signal & Separation Guide
Flow cytometry is a powerful tool for analyzing cell populations based on surface or intracellular markers. However, one of the most common challenges researchers encounter is weak fluorescence intensity or poor separation between positive and negative populations, making it difficult to identify or quantify the cells of interest.
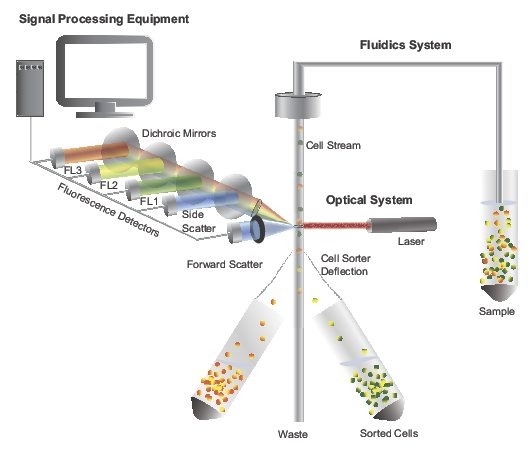
Weak signals can result from issues with sample preparation, antibody staining, instrument settings, or biological factors. This guide outlines the most common causes and practical solutions to help improve data quality.
Problem
After data acquisition:
- The positive population is barely distinguishable from the negative population.
- Fluorescence intensity is much lower than expected.
- Positive and negative populations overlap significantly.
- Cell populations are difficult to gate accurately.
Possible Cause 1: Low Target Antigen Expression
Some cell surface or intracellular proteins are naturally expressed at low levels or only under specific biological conditions.
What to check
- Is the target antigen expected to be expressed in your sample?
- Is expression activation- or treatment-dependent?
- Has expression been confirmed in the literature or previous experiments?
Solutions
- Include a positive control sample with known antigen expression.
- Stimulate cells if the marker is inducible.
- Use brighter fluorophores for low-abundance targets.
- Increase the number of events collected to improve detection of rare populations.
Possible Cause 2: Insufficient Antibody Staining
Incorrect antibody concentration or staining conditions can reduce fluorescence intensity.
What to check
- Was the antibody diluted according to the manufacturer's recommendation?
- Was sufficient antibody added for the number of cells?
- Were staining time and temperature appropriate?
Solutions
- Perform antibody titration to determine the optimal concentration.
- Incubate for the recommended duration, typically 20--30 minutes for surface staining.
- Avoid excessive antibody dilution.
- Protect fluorophore-conjugated antibodies from light during staining.
Possible Cause 3: Poor Cell Viability
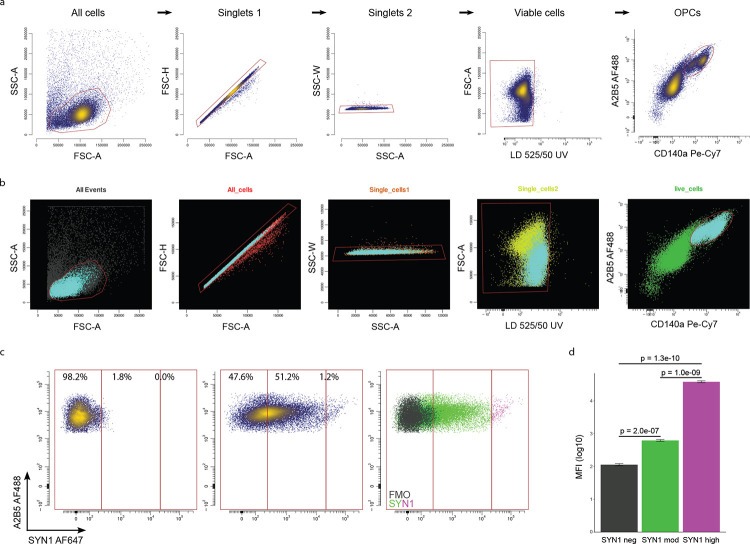
Dead or damaged cells often produce weak, variable, or nonspecific fluorescence signals.
What to check
- What is the cell viability before staining?
- Were cells handled gently during sample preparation?
- Were viability dyes included?
Solutions
- Use freshly prepared cell suspensions whenever possible.
- Minimize mechanical stress during sample preparation.
- Include a viability dye to exclude dead cells during analysis.
- Keep cells on ice when appropriate to preserve viability.
Possible Cause 4: Improper Instrument Settings
Even well-stained samples can appear weak if detector settings are not optimized.
What to check
- Photomultiplier tube (PMT) voltages
- Laser configuration
- Compensation settings
- Instrument quality control results
Solutions
- Optimize PMT voltages using unstained and positive control samples.
- Perform daily instrument quality control according to the manufacturer's recommendations.
- Verify that the selected fluorophores match the available laser lines and filters.
- Recalculate compensation using freshly prepared single-stained controls.
Possible Cause 5: Fluorophore Selection Is Not Optimal
Some fluorophores produce relatively dim signals or are incompatible with highly autofluorescent samples.
What to check
- Is the fluorophore bright enough for the target antigen?
- Does the fluorophore match the cytometer configuration?
- Is spectral overlap affecting signal resolution?
Solutions
- Assign the brightest fluorophores to the lowest-expressed markers.
- Avoid unnecessary spectral overlap when designing multicolor panels.
- Use tandem dyes carefully and protect them from prolonged light exposure.
Possible Cause 6: High Background or Autofluorescence
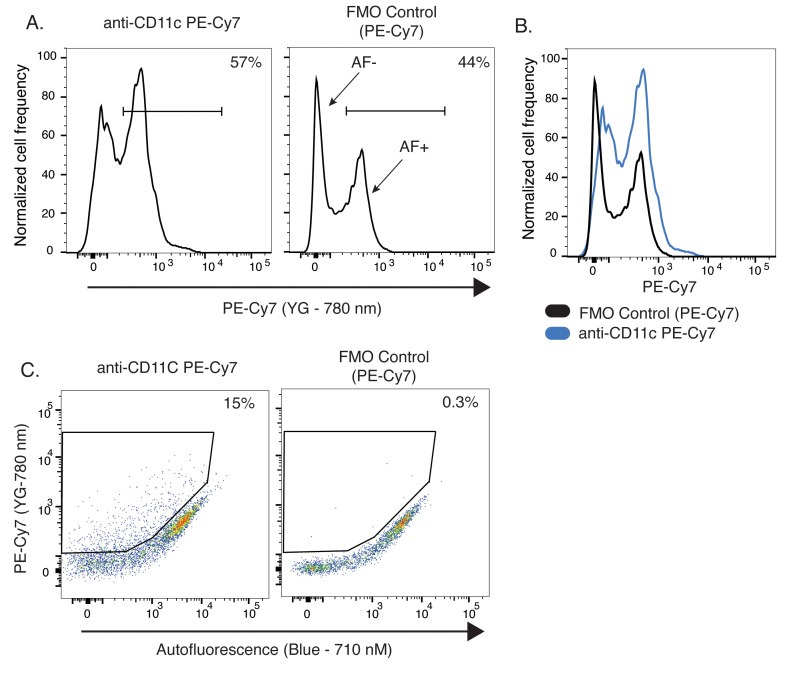
Background fluorescence reduces the contrast between positive and negative populations.
What to check
- Does the sample contain highly autofluorescent cells?
- Were Fc receptors blocked before staining?
- Is nonspecific antibody binding occurring?
Solutions
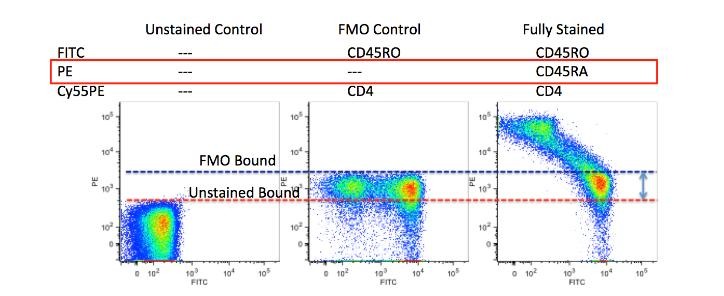
- Include fluorescence minus one (FMO) controls when establishing gating strategies.
- Use Fc receptor blocking reagents when working with immune cells.
- Include unstained controls to assess autofluorescence.
- Wash cells thoroughly after staining.
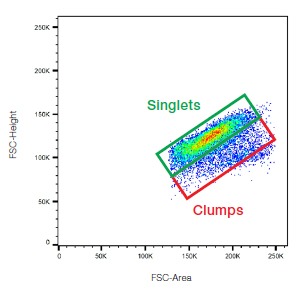
Possible Cause 7: Cell Clumping or Inadequate Sample Preparation
Cell aggregates can interfere with fluorescence measurements and increase data variability.
What to check
- Are cell aggregates visible before acquisition?
- Was the sample filtered?
- Was EDTA included in the staining buffer if appropriate?
Solutions
- Filter samples through a 35--70 μm cell strainer before acquisition.
- Resuspend cells thoroughly before loading.
- Include EDTA in staining buffers when compatible with the experiment.
- Exclude doublets during data analysis using forward scatter (FSC) and side scatter (SSC) gating strategies.
Quick Troubleshooting Checklist
| Observation | Most Likely Cause | Recommended Action |
|---|---|---|
| Weak fluorescence in all samples | Instrument or staining issue | Optimize PMT settings and antibody concentration |
| Positive and negative populations overlap | Low signal or high background | Titrate antibodies and improve gating strategy |
| High background fluorescence | Autofluorescence or nonspecific binding | Include FMO controls and Fc blocking |
| Large number of dead cells | Poor sample quality | Improve cell handling and use viability dyes |
| Irregular scatter plots | Cell aggregates | Filter samples and exclude doublets |
Best Practices for Reliable Flow Cytometry
High-quality flow cytometry data depend on careful optimization at every stage of the experiment.
To improve signal quality and population resolution:
- Use high-quality, single-cell suspensions.
- Optimize antibody concentration through titration.
- Include unstained, single-color, FMO, and positive control samples.
- Exclude dead cells using viability dyes.
- Match fluorophore brightness to antigen expression levels.
- Perform routine instrument quality control and compensation before acquisition.
By systematically optimizing sample preparation, staining conditions, and instrument settings, researchers can significantly improve fluorescence intensity, reduce background, and obtain reproducible, high-quality flow cytometry data.
Frequently Asked Question
Q: My antibody worked well in immunofluorescence, but the signal is weak in flow cytometry. Why?
Although both techniques use antibodies to detect proteins, they measure antigens under very different conditions. Immunofluorescence visualizes proteins in fixed cells or tissues, while flow cytometry analyzes individual cells in suspension. An antibody that performs well in IF may not recognize native epitopes on intact cells or may not be validated for flow cytometry. Additionally, fluorophore brightness, antibody titration, cell viability, and instrument settings all have a greater impact on flow cytometry performance. Choosing antibodies validated for flow cytometry and optimizing staining conditions are essential for achieving strong and reproducible signals.


