
This guide is designed to help you systematically interpret flow cytometry data, even if you are new to the technique. Rather than focusing on theory, it provides a structured approach to evaluating plots, identifying cell populations, and assessing data quality.
1. What Does Flow Cytometry Measure?
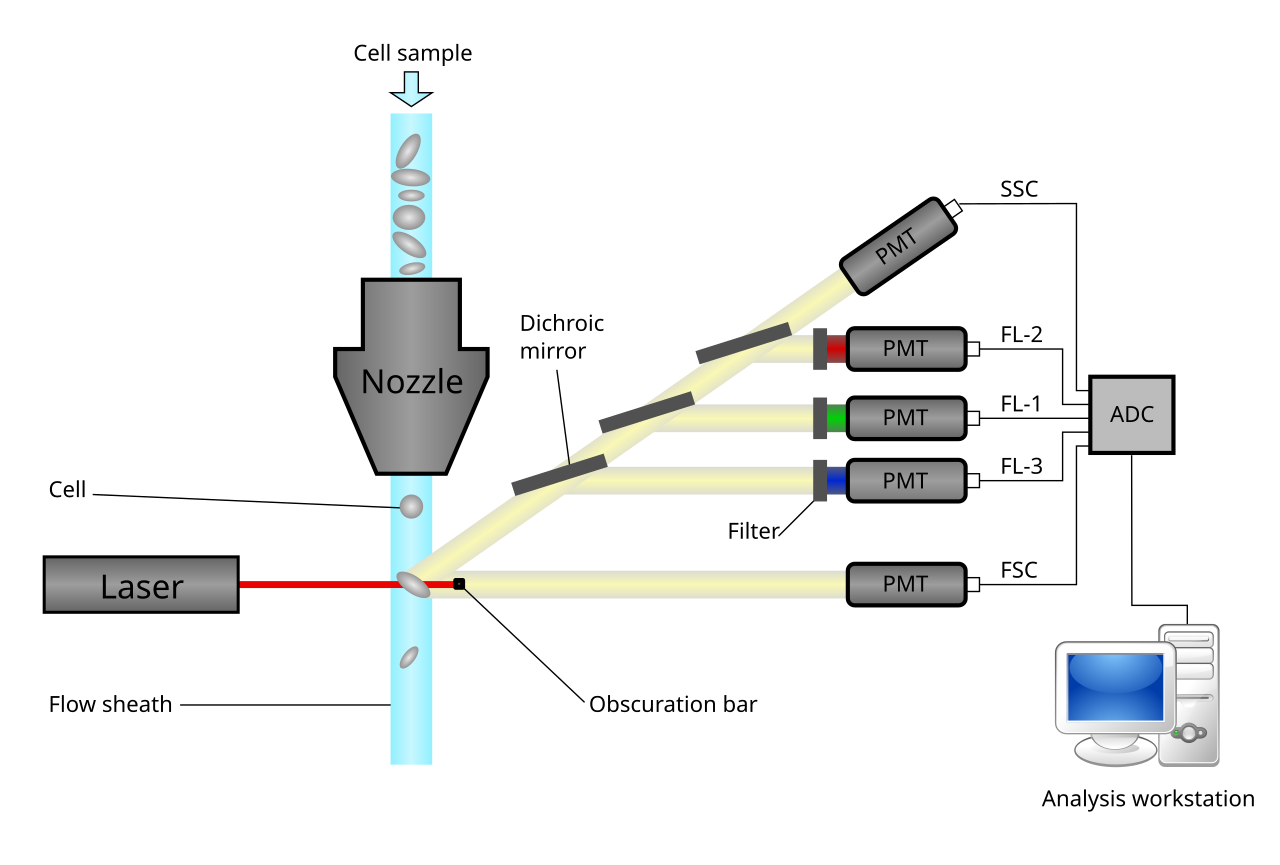
Flow cytometry enables rapid, quantitative characterization of individual cells as they pass through a laser beam.
Instead of generating images, the system records optical signals, including:
- Forward scatter (FSC): correlated with cell size
- Side scatter (SSC): associated with internal complexity or granularity
- Fluorescence intensity: derived from labeled antibodies targeting specific markers
Each event displayed on a plot represents a single cell, positioned according to its measured signal intensities.
It is important to note that FSC and SSC are not direct physical measurements. These parameters are influenced by multiple factors, including cell morphology and refractive index, and should therefore be interpreted as relative indicators rather than absolute values.
2. A Structured Approach to Reading Flow Cytometry Data
Accurate interpretation depends less on the number of parameters and more on applying a consistent analytical workflow.
A practical sequence is:
Population distribution → Marker expression → Quantitative interpretation
2.1 Evaluate FSC/SSC Distribution
Initial assessment should focus on FSC versus SSC plots to evaluate overall sample quality.
Key considerations include:
- Presence of clearly defined cell populations
- Separation between major clusters
- Extent of debris accumulation (typically low FSC/SSC region)
Poor separation or high debris levels do not necessarily invalidate the dataset, but they require more stringent gating strategies in downstream analysis.
In standard workflows, this step is followed by:
- Doublet discrimination (to isolate single cells)
- Viability gating (to exclude dead cells)
Failure to apply these steps may introduce significant bias.
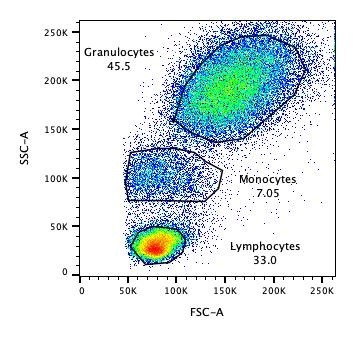
- Higher FSC → typically larger cells
- Lower FSC → smaller cells or debris
- Higher SSC → increased granularity (e.g., granulocytes)
- Lower SSC → less complex cells (e.g., lymphocytes)
2.2 Assess Fluorescence Signals
Once population distribution is confirmed, fluorescence signals can be analyzed to identify specific cell subsets.
A critical point is that fluorescence intensity must be interpreted relative to a defined positivity threshold, rather than as simply "present" or "absent."
Accurate thresholding requires appropriate controls. Without them, low-level signals may represent background rather than true marker expression.
Histogram-Based Analysis
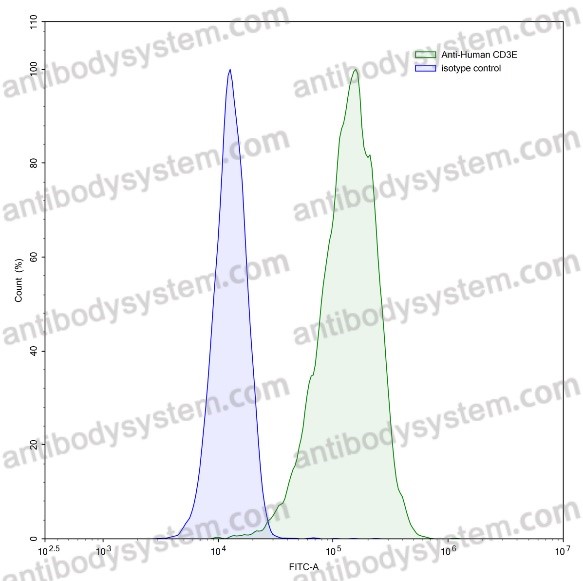
In addition to scatter plots, fluorescence is frequently visualized using single-parameter histograms.
- X-axis: fluorescence intensity
- Y-axis: event count
Histograms provide a simplified view of signal distribution within a population.
Interpretation principles:
- A single peak suggests a relatively homogeneous population
- Multiple peaks indicate distinct subpopulations
In controlled experiments, negative and positive populations are typically resolved as separate peaks.
Anti-Human CD3 Antibody (UCHT1) [FHC27760]
Applications of Histograms
- Cell cycle analysis
- Apoptosis and viability assessment
- Proliferation studies
Quantitative metrics such as mean fluorescence intensity (MFI) can also be derived for:
- Antibody binding characterization
- Functional assays (e.g., EC50 determination)
2.3 Interpret Population Frequencies
Percentages displayed in flow cytometry plots must always be interpreted in context.
All frequency values are calculated relative to a defined parent population, not the total sample. Without understanding this hierarchy, numerical results may be misleading.
3. Example Workflow: Stepwise Gating Strategy
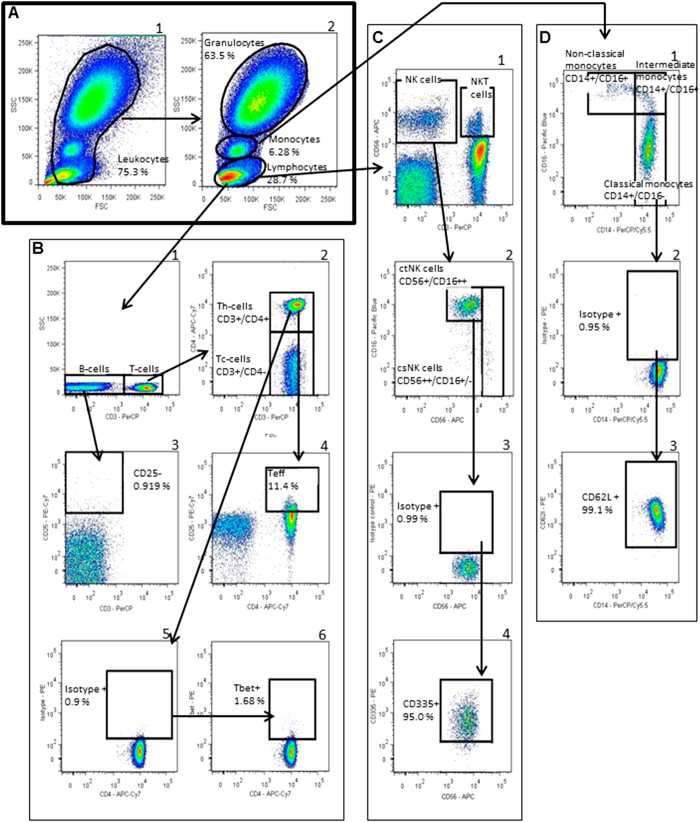
The following example illustrates a typical analysis workflow using human peripheral blood.
Step 1: Identification of Major Cell Populations
An FSC vs SSC plot resolves three primary populations:
- Lymphocytes: small size, low complexity
- Monocytes: intermediate size and complexity
- Granulocytes: larger, highly granular
Clear separation at this stage indicates acceptable sample quality.
Step 2: T Cell Identification and Subsetting
Within the lymphocyte gate:
- CD3 is used to distinguish T cells (CD3⁺) from non-T cells (CD3⁻)
- CD4 further separates:
- Helper T cells (CD3⁺CD4⁺)
- Cytotoxic T cells (CD3⁺CD4⁻)
Step 3: NK and NKT Cell Characterization
NK-related populations are identified using CD3 and CD56:
- CD3⁻CD56⁺: NK cells
- CD3⁺CD56⁺: NKT cells
NK subsets can be further defined based on CD56 and CD16 expression:
- CD56dim CD16⁺: cytotoxic phenotype
- CD56bright CD16⁺/−: cytokine-producing phenotype
Step 4: Monocyte Subset Analysis
Within the monocyte gate, CD14 and CD16 are used to define subsets:
- Classical: CD14⁺⁺CD16⁻
- Intermediate: CD14⁺⁺CD16⁺
- Non-classical: CD14⁻CD16⁺
This level of analysis provides deeper insight into functional heterogeneity.
4. Key Takeaways
Effective flow cytometry analysis relies on a consistent and structured workflow rather than isolated parameter interpretation.
A robust analytical sequence typically includes:
FSC/SSC evaluation → singlet gating → viability exclusion → fluorescence-based identification → frequency analysis
Applying this framework allows most datasets to be interpreted in a reproducible and reliable manner.
AntibodySystem Flow Cytometry Antibodies
AntibodySystem provides a comprehensive portfolio of flow cytometry antibodies targeting commonly used markers, including CD3, CD4, CD8, and CD14.
Products are available with multiple fluorophore conjugations (e.g., FITC, PE, APC), along with corresponding isotype controls, supporting flexible panel design and consistent experimental performance.
Ready-to-ship inventory ensures reliable supply for routine and large-scale studies.
| Catalog No. | Product Name |
|---|---|
| FMD41010 | Anti-Mouse CD11a/ITGAL Antibody (FD441.8) |
| FHC27760 | Anti-Human CD3 Antibody (UCHT1) |
| FMG17610 | Anti-Mouse CD47/MER6 Antibody (A4) |
| FMC27730 | Anti-Mouse CD3E Antibody (500A2) |
| FMG33810 | Anti-Mouse CD161/KLRB1/NK1.1 Antibody (PK136) |
| FHJ63910 | Anti-Human CD93/C1qR Antibody (070-016) |
| FHF34010 | Anti-Human CD81 Antibody (5A6) |
| FHC41820 | Anti-Human CD7 Antibody (3A1e) |
| FHD15110 | Anti-Human CD62P/SELP Antibody (SelG1) |
| FHM00110 | Anti-Human HLA-A,B,C Antibody (W6/32) |
| FMC06715 | Anti-Mouse CSF2/GM-CSF Antibody (Fs0380), AF488 |
| FMC06714 | Anti-Mouse CSF2/GM-CSF Antibody (Fs0380), PerCP |
| FMB96910 | Mouse IgG2C Isotype Control Antibody (HyHEL-10) |
| FMB96820 | Mouse IgG2b, kappa Isotype Control Antibody (MPC-11) |


