The generation of the VBASE2 database was previously described (Retter et al. 2005). The VBASE2 database currently holds for the human 61 heavy chain variable gene segments, 50 kappa light chain variable gene segments and 49 lambda light chain variable gene segments of Class 1. For the mouse, the database keeps 153 heavy chain variable gene segments, 77 kappa light chain variable gene segments and three lambda light chain sequences of Class 1. The complete statistics of the database can be accessed under the V Gene Statistics section of the website menu (Fig. 1.1). From the Internet page, the user can make a query in the VBASE2 database and view all gene entries of a class by simply clicking on the referring number in the statistics table. The user can also download the V gene sequences contained in the VBASE2 database under the Download section of the website menu. Each V gene segment present in the VBASE2 database has a unique identification number. Behind this number, an individual V gene segment entry is present in the database, which provides key information of a given gene. An example of such an entry is shown in Fig. 1.2.
This is an example of a Class 1 sequence indicating that both the germline gene and the rearrangements are known. The functionality is indicated. All known sequence names are presented. The V gene family is given and the date of the last update is provided.
Both the nucleotide and the protein sequences are shown in FASTA format (and can be easily copied for further analyses and storage). The position of key features of the nucleotide sequence, such as framework regions (FR) and complementary determining regions (CDR), is indicated, and the positions of the three most conserved amino acids are given. The source of both the genomic and the rearranged sequence are shown, and, finally, cross references to the other three major V gene databases, VBASE (in case of human sequences) (http://vbase.mrc-cpe.cam. ac.uk/), IMGT (Lefranc et al. 1999), and KABAT (Johnson and Wu 2001) are provided.
Statistics of V gene sequences in VBASE2
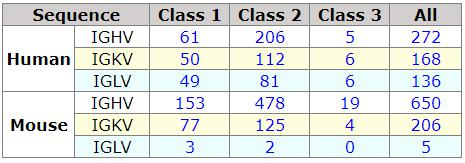
Class 1 sequences are supported by a genomic sequence and a rearrangement.
Class 2 contains sequences with genomic evidence only and class 3 holds sequences which have been found in rearrangements only.
Fig. 1.1 Statistics of the V gene segments present in VBASE2

Fig. 1.2 Example of a VBASE2 entry (ID humIGHV047)
How to Use the Fab Analysis Tool
The antibody consists of two polypeptide chains, the heavy and the light chain. The DNAPLOT Query tool allows the analysis of both heavy and light chains, but the sequences have to be input separately. As nowadays many antibody sequences are generated from phage display libraries, it is necessary to provide a way to analyse both the variable region of a heavy chain and of a light chain at the same time. For this purpose we created a new tool, which we termed the Fab Analysis tool (Mollova et al. 2007). It is available from the menu of the VBASE2 website. Once the menu line is selected the input box of the Fab Analysis tool opens (Fig. 1.3).
You can input either a single sequence in RAW format or multiple sequences in FASTA format. Ideally, each sequence contains both the heavy and the light chain variable gene segments, but this is not a prerequisite. The tool is also able to analyse partial sequences.
In the following example a set of eight selected sequences of a phage display library is used for an illustration analysis. The sequences contain both heavy and light chain sequences. Once the sequence data are inserted into the input window and the analysis is started, the Fab Analysis tool program will automatically extract the heavy and the light chain variable gene segment and will perform further sequence analyses. Multiple sequences can be copied into the Fab Input window.
The tool can analyse many sequences in one run. However, it is recommendable to analyse about 10–15 sequences at a time in order to easily navigate in the output of the program (Fig. 1.4).
The first lines of the output of the Fab Analysis tool (Fig. 1.5) provide links to conveniently navigate within the output of the analysis. The head line contains links to the major sections of the output that are explained in more detail as follows. CDR Comparison shows the amino acid sequences of all six CDR regions of the antibody sequences analysed. It provides a nice overview about the potential contact residues of a particular antibody to the antigen. FASTA sequences links to the nucleotide sequences that were used for the analysis and their amino acid translation, shortened to the positions corresponding a V(D)J rearrangement (CDR1-FR4). It is possible to copy these sequences to use them for further tests. The tool has extracted the heavy and light chain sequences separately, and the individual sequence names have an L (for light chain) and an H (for heavy chain) attached to the sequence names. csv Tables links to the summary output of the analysis in a comma-separated format that can be easily copied and pasted into a database program or into a spread sheet program.
Mutation table provides a summary of mutations in the variable gene segments when compared to the closest known germline variable gene segment.
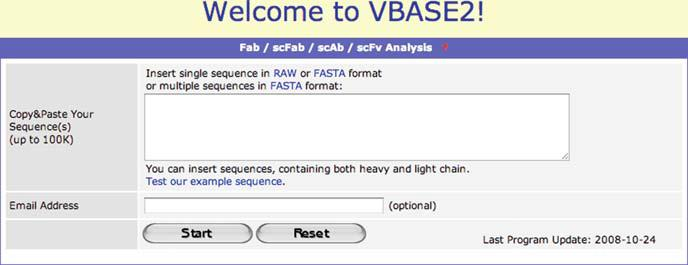
Fig. 1.3 Input box of the VBASE2 Fab Analysis tool
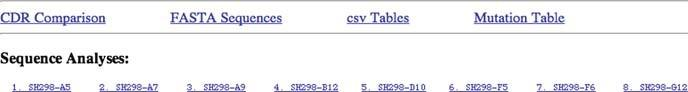
Fig. 1.4 First lines of the output
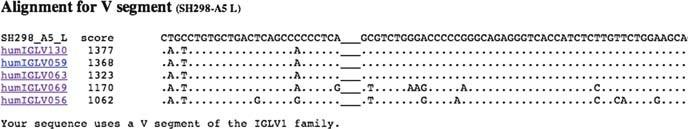
Fig. 1.5 Alignment of the input sequence and the five best matches in the VBASE2 database
Output for the Individual Sequences
The individual parts of the output are displayed and discussed later. In the first lines of the output, the DNAPLOT analysis program displays links to the results for each of the sequences analysed (Fig. 1.5). Thereby, it creates a separate link for each of the input sequences. The heavy and the light chain sequences are recog- nized automatically.
The SH298-A5 Single Chain Antibody Sequence is Used as Example for Showing the Results
The first part of the light chain sequence analysis (alignment of the V segment) is displayed in Fig. 1.6. The search sequence is shown on top. The following five lines show the sequences of the five best V gene matches within the VBASE2 database. The beginning of these lines contains links that point to the individual VBASE2 entries. When one activates the links, a new window with the database entry will open (for example see Fig. 1.2).
The sequences are aligned using the IMGT numbering schema (Lefranc et al. 2003). The positions in the VBASE2 entry that are identical to the search sequence are indicated by dots; the other positions are shown as single letter indicating the mismatching nucleotide. The included alignment gaps are marked by underscores. The window is scrollable, so the complete sequence can be viewed.
Fig. 1.6 Alignment of the J element of the search sequenceIn Fig. 1.6, the alignment of the J element with the best three matches is shown. In Fig. 1.7, the program displays the various parts of the junction sequence. The sequence at the level of nucleotides and amino acids is colour coded. Germline sequences are indicated in black. N nucleotides are shown in red, and the so-called P nucleotides, if present, are shown in pink.
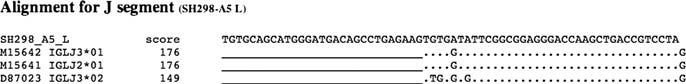
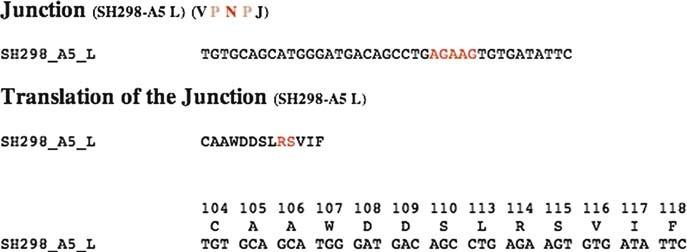
Fig. 1.7 Display of the junction
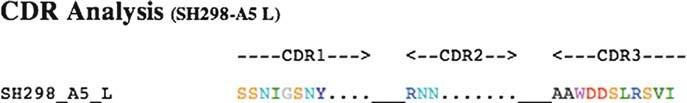
In Fig. 1.8, the CDR regions of the antibody sequence (single chain) are shown atthe level of amino acids. The amino acids are colour coded according to their amino acid properties. The colour code uses the values as defined by the Ramos (Sayle and Milner-White 1995) “amino colour scheme” and are as follows: ASP and GLU are bright red, CYS and MET are yellow, LYS and ARG are blue, SER and TYR are mid-blue, ASN and GLN are Cyan, LEU, VAL and ILE are green, TRP is purple, HIS is pale blue, PRO is flesh and others are tan. According to RasMol, GLY is light grey and ALA is dark grey, but the used grey colours in VBASE2 are darker because of the different background colour. The colour table can be viewed at the RasMol Internet page (http://www.openrasmol.org/doc/rasmol.html#aminocolours). The alignments shown in Figs. 1.10 and 1.11 close the output of the individual sequence analysis. They display the nucleotide alignment of the rearrangement and its translation shown with delimitations and
numbering for all CDRs and FRs.
Fig. 1.8 CDR analysis

Fig. 1.9 Search sequences and the best five matches shown as IMGT alignment at the level of nucleotides

Fig. 1.10 Search sequence and the best match shown in the IMGT alignment both at the level of nucleotides and amino acids
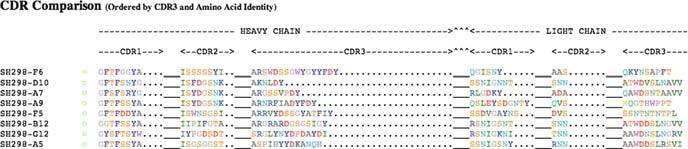
Fig. 1.11 The CDR comparison output of all tested sequences displaying the combination of heavy and light chain CDRs
Summing It All Up: Output of All Sequences Analysed
When the analysis of the individual sequences is finished, a summary of the results from all the sequences is displayed in various forms. The most compressed and informative representation is the CDR comparison alignment of the combination of heavy and light chain CDRs (Fig. 1.11). The amino acids of the CDR regions are aligned according to the IMGT numbering schema, and the amino acids are colour coded according to their chemical properties.
In the example shown in Fig. 1.11, a collection of phages binding to one antigen are displayed. If one carefully analyses the sequences, a pattern can be observed in the selected clones. This output could be a good indication on the diversity of the selected clones and might give indications on properties of the binding clones.
The final output of the program, not shown here, is a summary of the analysed sequences in various formats useful for further processes. As mentioned earlier, the extracted and analysed sequences are given in FASTA file format at the level of amino acids and nucleotides. The various regions of the sequences, frameworks and CDR regions are given, and the best matches are shown in a comma-separated values format to be imported into databases and spread sheet programs. Finally, a mutation analysis is performed indicating the number of mutations in the analysed sequences when compared to our germline sequence list.
References
http://vbase.mrc-cpe.cam.ac.uk/ http://www.openrasmol.org/doc/rasmol.html#aminocolours
Johnson G, Wu TT (2001) KabatDatabase and its applications: future directions. Nucleic Acids Res 29:205–206.
http://www.kabatdatabase.com
Lefranc MP, Giudicelli V, Ginestoux C, Bodmer J, Mu¨ller W, Bontrop R, Lemaitre M, Malik A, Barbie V, Chaume D (1999) IMGT, the international ImMunoGeneTics database. Nucleic Acids Res 27:209–212. http://imgt.cines.fr
Lefranc MP, Pommie C, Ruiz M, Giudicelli V, Foulquier E, Truong L, Thouvenin-Contet V, Lefranc G (2003) IMGT unique numbering for immunoglobulin and T cell receptor variable domains and Igsuperfamily V-like domains. Dev Comp Immunol 27(1):55–77.
http://imgt. cines.fr/textes/IMGTScientificChart/Numbering/IMGTnumbering.html
Mollova S, Retter I, Mu¨ller W (2007) Visualising the immune repertoire. BMC Syst Biol 1(Suppl 1): P30
Retter I, Althaus HH, Mu¨nch R, Mu¨ller W (2005) VBASE2, an integrative V gene database.
Nucleic Acids Res 33(Database issue): D671–D674. http://www.vbase2.org
Sayle RA, Milner-White EJ (1995) RASMOL: biomolecular graphics for all. Trends Biochem Sci 20(9):374


